Every year, the City Controller’s Office releases a report on how well our parks are being upkept by the SF Recreation and Park Department (RPD). The 2023 report shows that overall, San Francisco’s parks are highly maintained, but there are a few key findings worth noticing.
Between July 2022 and June 2023, a total of 732 evaluation visits to every city park monitored if maintenance standards were met, scoring the condition of amenities like athletic fields, dog runs, restrooms, and trees. Each park gets a percentage score, which averaged together creates the city-wide Park Maintenance Score.
The Good
Last year, San Francisco’s city parks scored a very respectable 91%, and this year they….(drumroll please) scored 91% again! This is bang on target for the city, who aim to score 85% at a minimum each year.
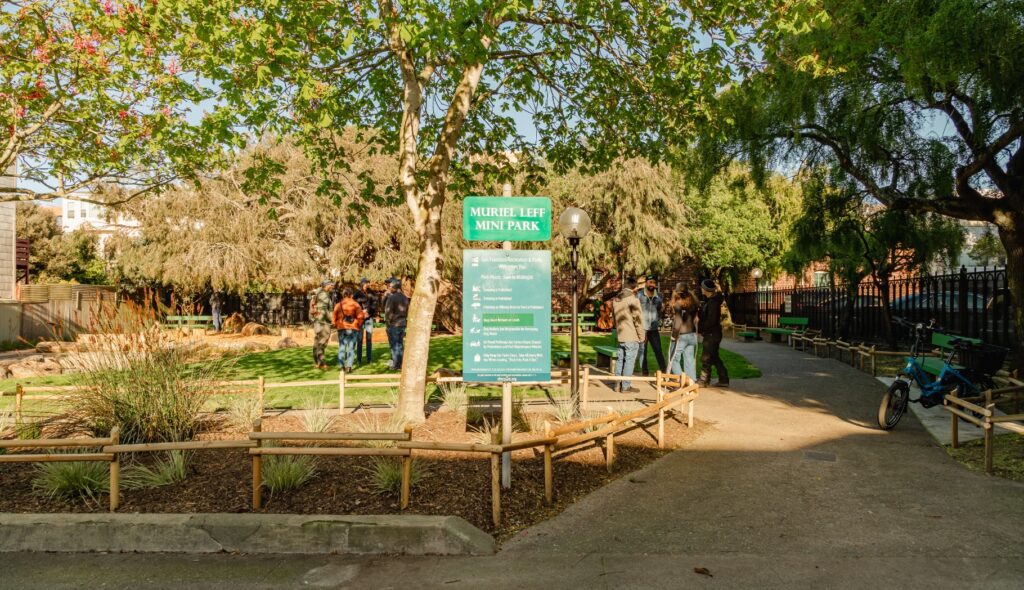
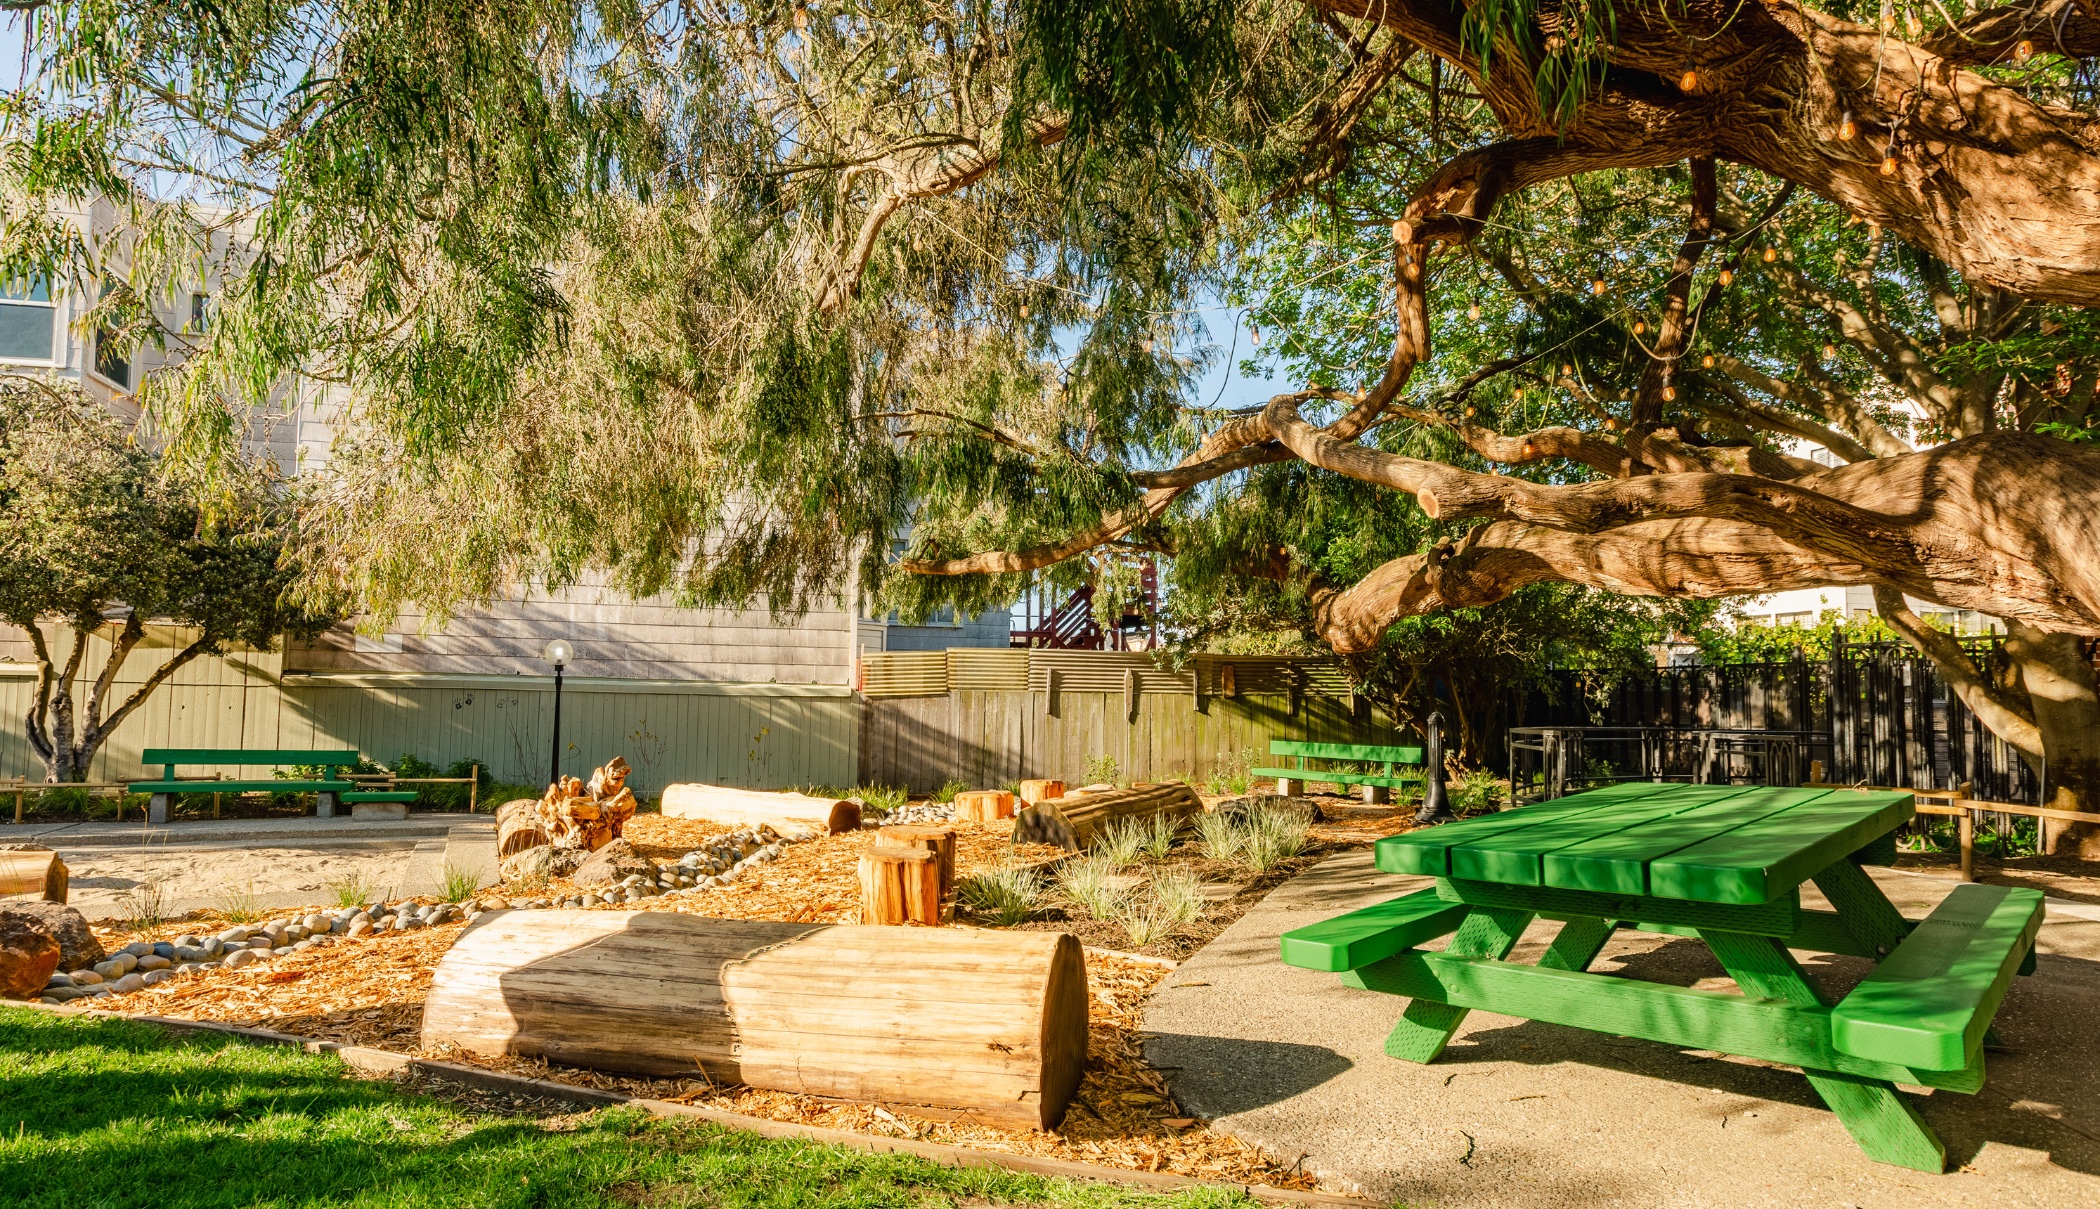
Of the 167 parks managed by RPD, 147 met or exceeded the minimum standard score of 85%. Two parks achieved a perfect score this year: Sunnyside Conservatory in Glen Park, and Muriel Leff Mini Park in the Inner Richmond, which SF Parks Alliance renovated in early 2023!

The Could Be Better
On the other end of the spectrum, Franklin Square was the lowest scoring park with just 71%. Franklin Square’s score worsened across the board, but the state of its playground was the worst amenity, scoring just 60%.
Another important metric for RPD are parks identified as being in ‘Equity Zones’- neighborhoods such as Bayview, the Mission and Visitacion Valley which have been disproportionately affected by environmental health risks. These parks, including Silver Terrace Playground and Garfield Square, scored slightly lower than non Equity Zone parks, at 89% (same as last year).

Here are some other notable facts from last year’s park maintenance scores:
- Two shiny new parks included this year were Francisco Park in Russian Hill (98%) and Shoreview Park in the Bayview (89%)
- The Supervisor district with the lowest average score was District 6 (82%), which is also the district with the fewest parks (six). The highest scoring district was a four-way tie between Districts 3, 4, 7, and 8 (92%).
- The amenity which dropped points most significantly was athletic fields, scoring an average of six points less across all parks compared to last year. RPD suggests this may be due to the impact of record rain levels.

