
Education
San Francisco Parks Got Their Maintenance Report Cards. How Did They Do?
Jess Smith / April 12, 2023How does San Francisco evaluate how well its parks are doing?
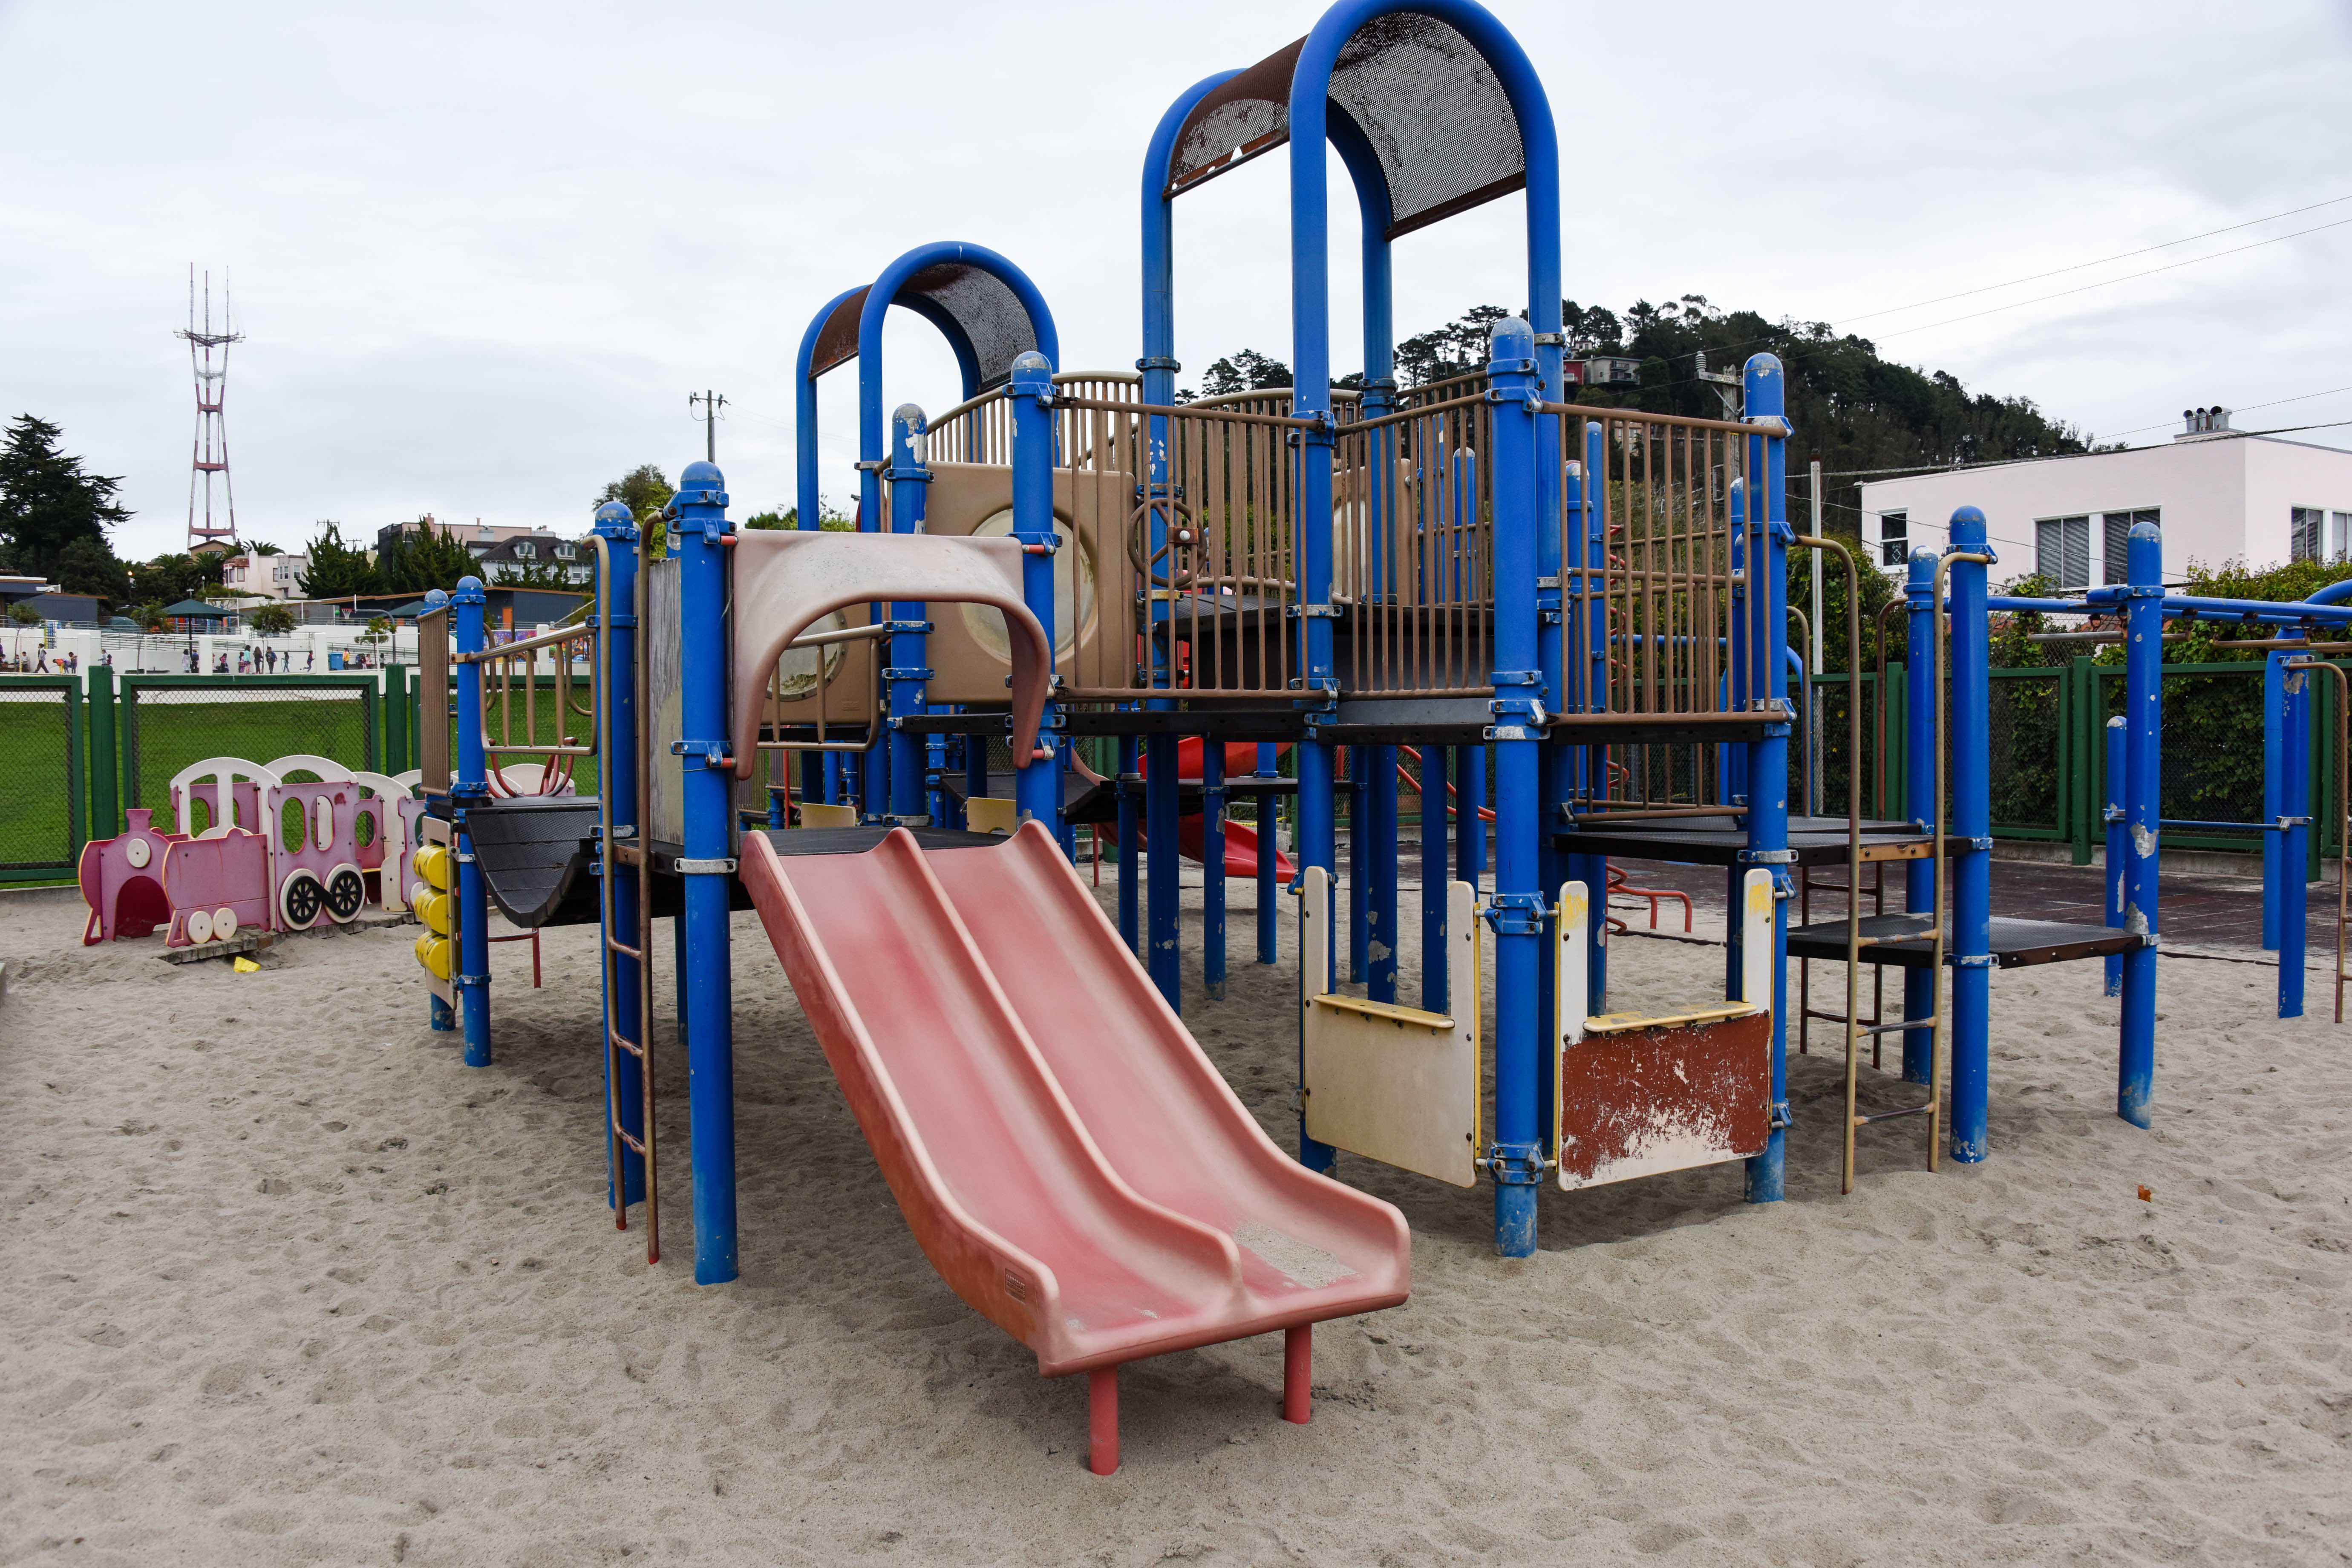
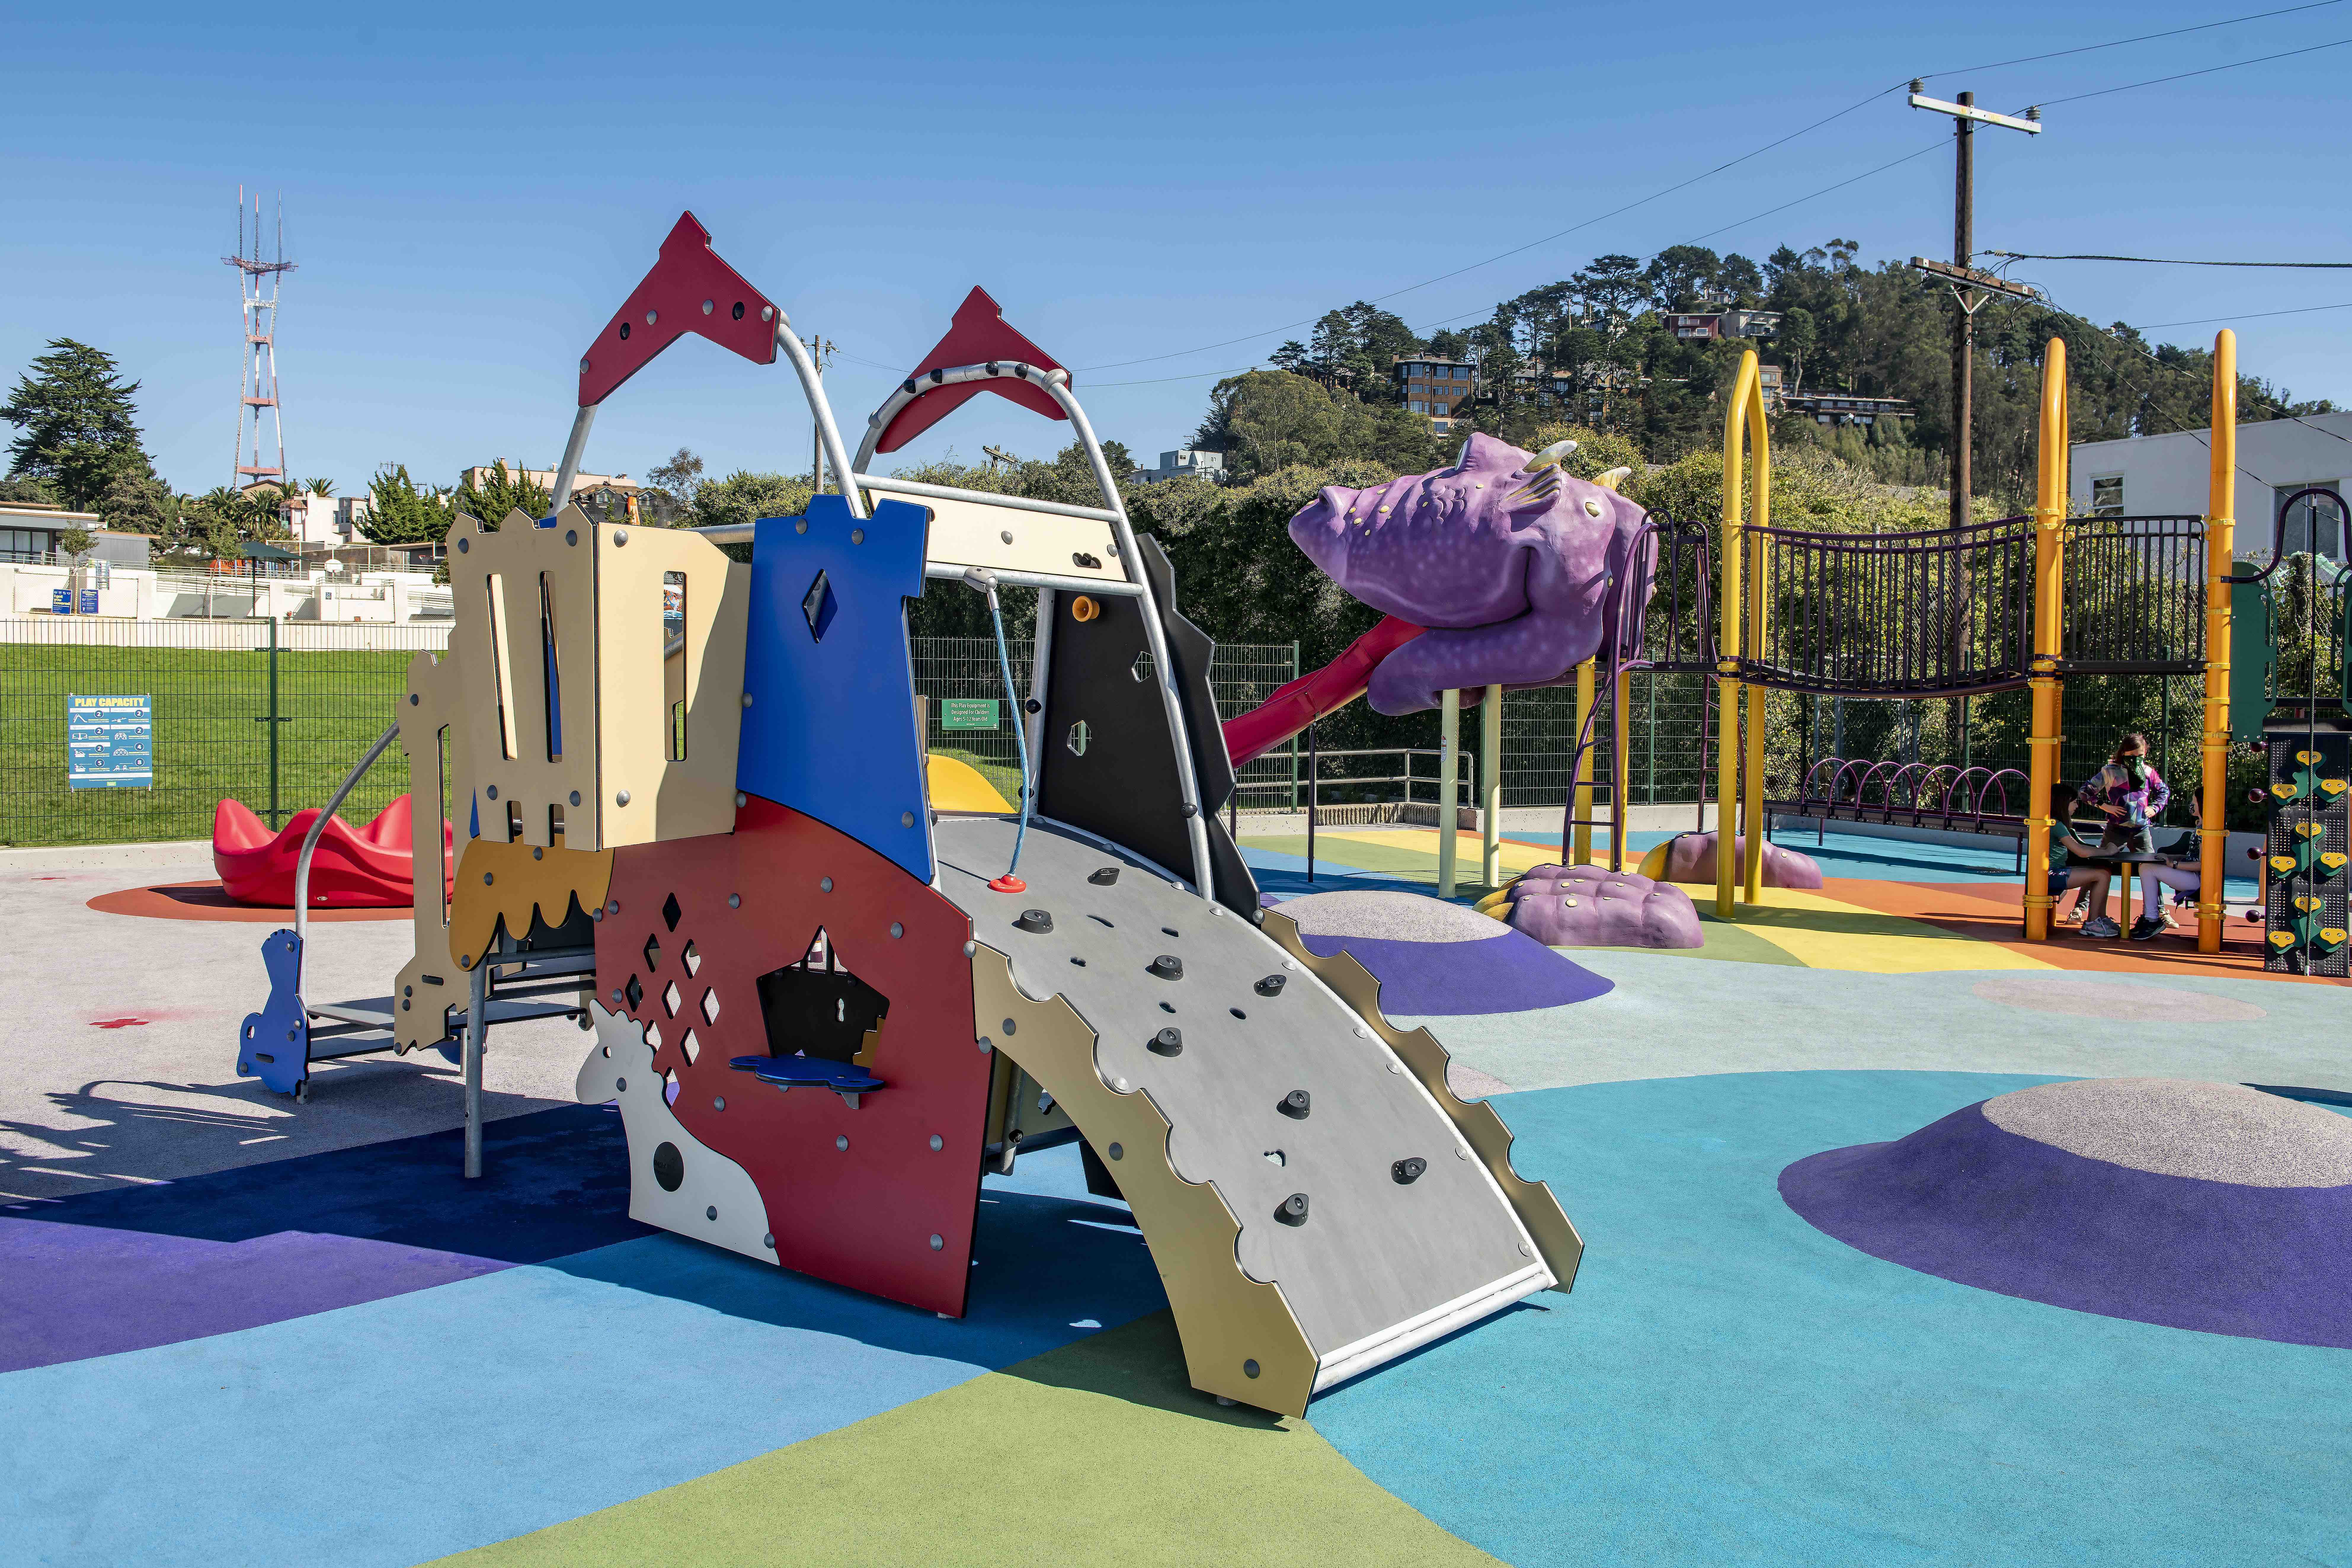
It’s exciting when new parks and public spaces like the recently unveiled Presidio Tunnel Tops and Francisco Park are completed, but maintenance through continued stewardship is what keeps our parks world class. In February the City Controller’s Office released data on the quality of parks and public spaces across San Francisco between June 2021 and 2022. Let’s review!
Here’s how it works: every 3 months, each of the 166 San Francisco parks managed by the Recreation and Parks Department (RPD) are evaluated against maintenance standards and then averaged for an annual score to help RPD know how/where to allocate resources where they’re needed most. There are 12 categories that parks are judged on, including athletic fields, children’s play areas, table seating areas, and trees.
The average score across all of San Francisco parks this year was 91/100, with six parks achieving a perfect score: DuPont Tennis Courts, Fay Park, Gilman Playground, Sunnyside Conservatory, Washington Square, and West Portal Playground.
Unfortunately, some parks fell far below the average score.
Lessing & Sears Mini Park , Park Presidio Boulevard , Franklin Square , Hilltop Park , and Visitacion Valley Greenway are the 5 lowest ranking parks this year, all scoring 78 or below. What’s even more concerning, all but Park Presidio Boulevard are in Equity Zones.
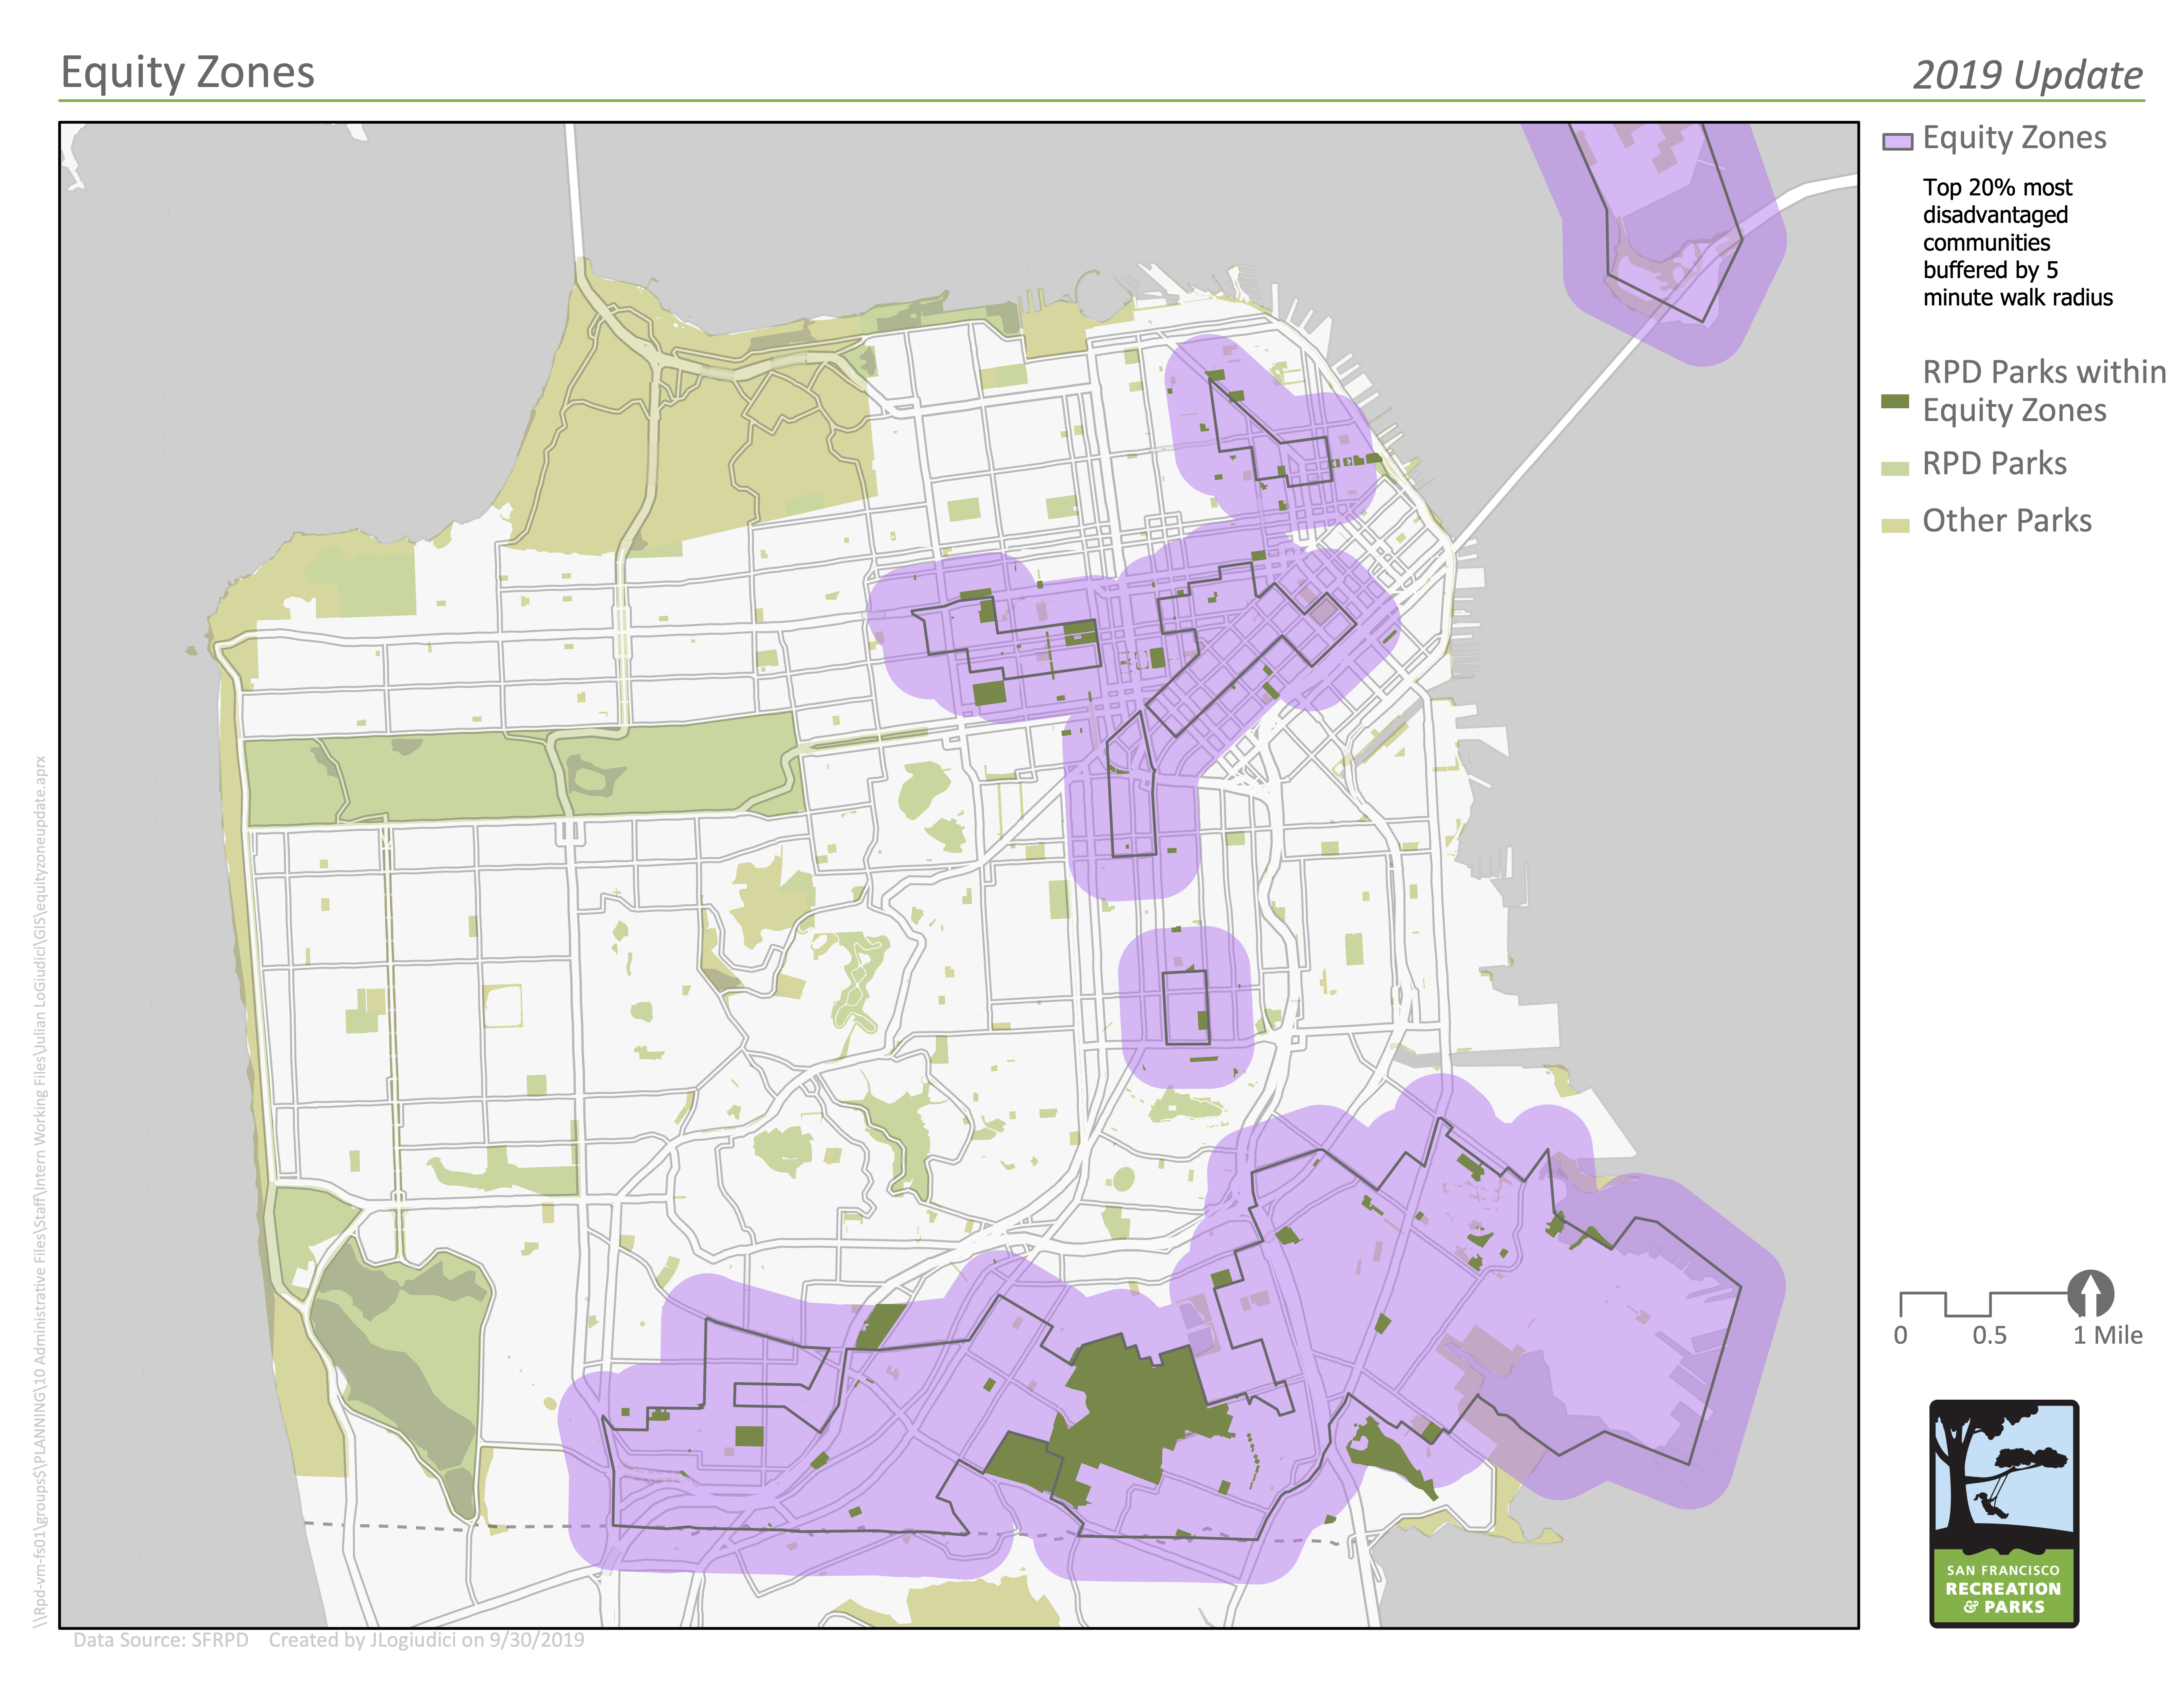
Why does this matter? SF’s Planning Department defines an Equity Zone as a “neighborhood that has suffered from historical environmental burdens, such as hazardous pollution harmful to the air, water, or soil.” Of the 166 parks evaluated, 81 were within an Equity Zone, averaging a score of 89.5 compared to the overall average of 91.
What’s more, is that on a district level, there were clear winners and losers, with districts home to equity zones losing out.
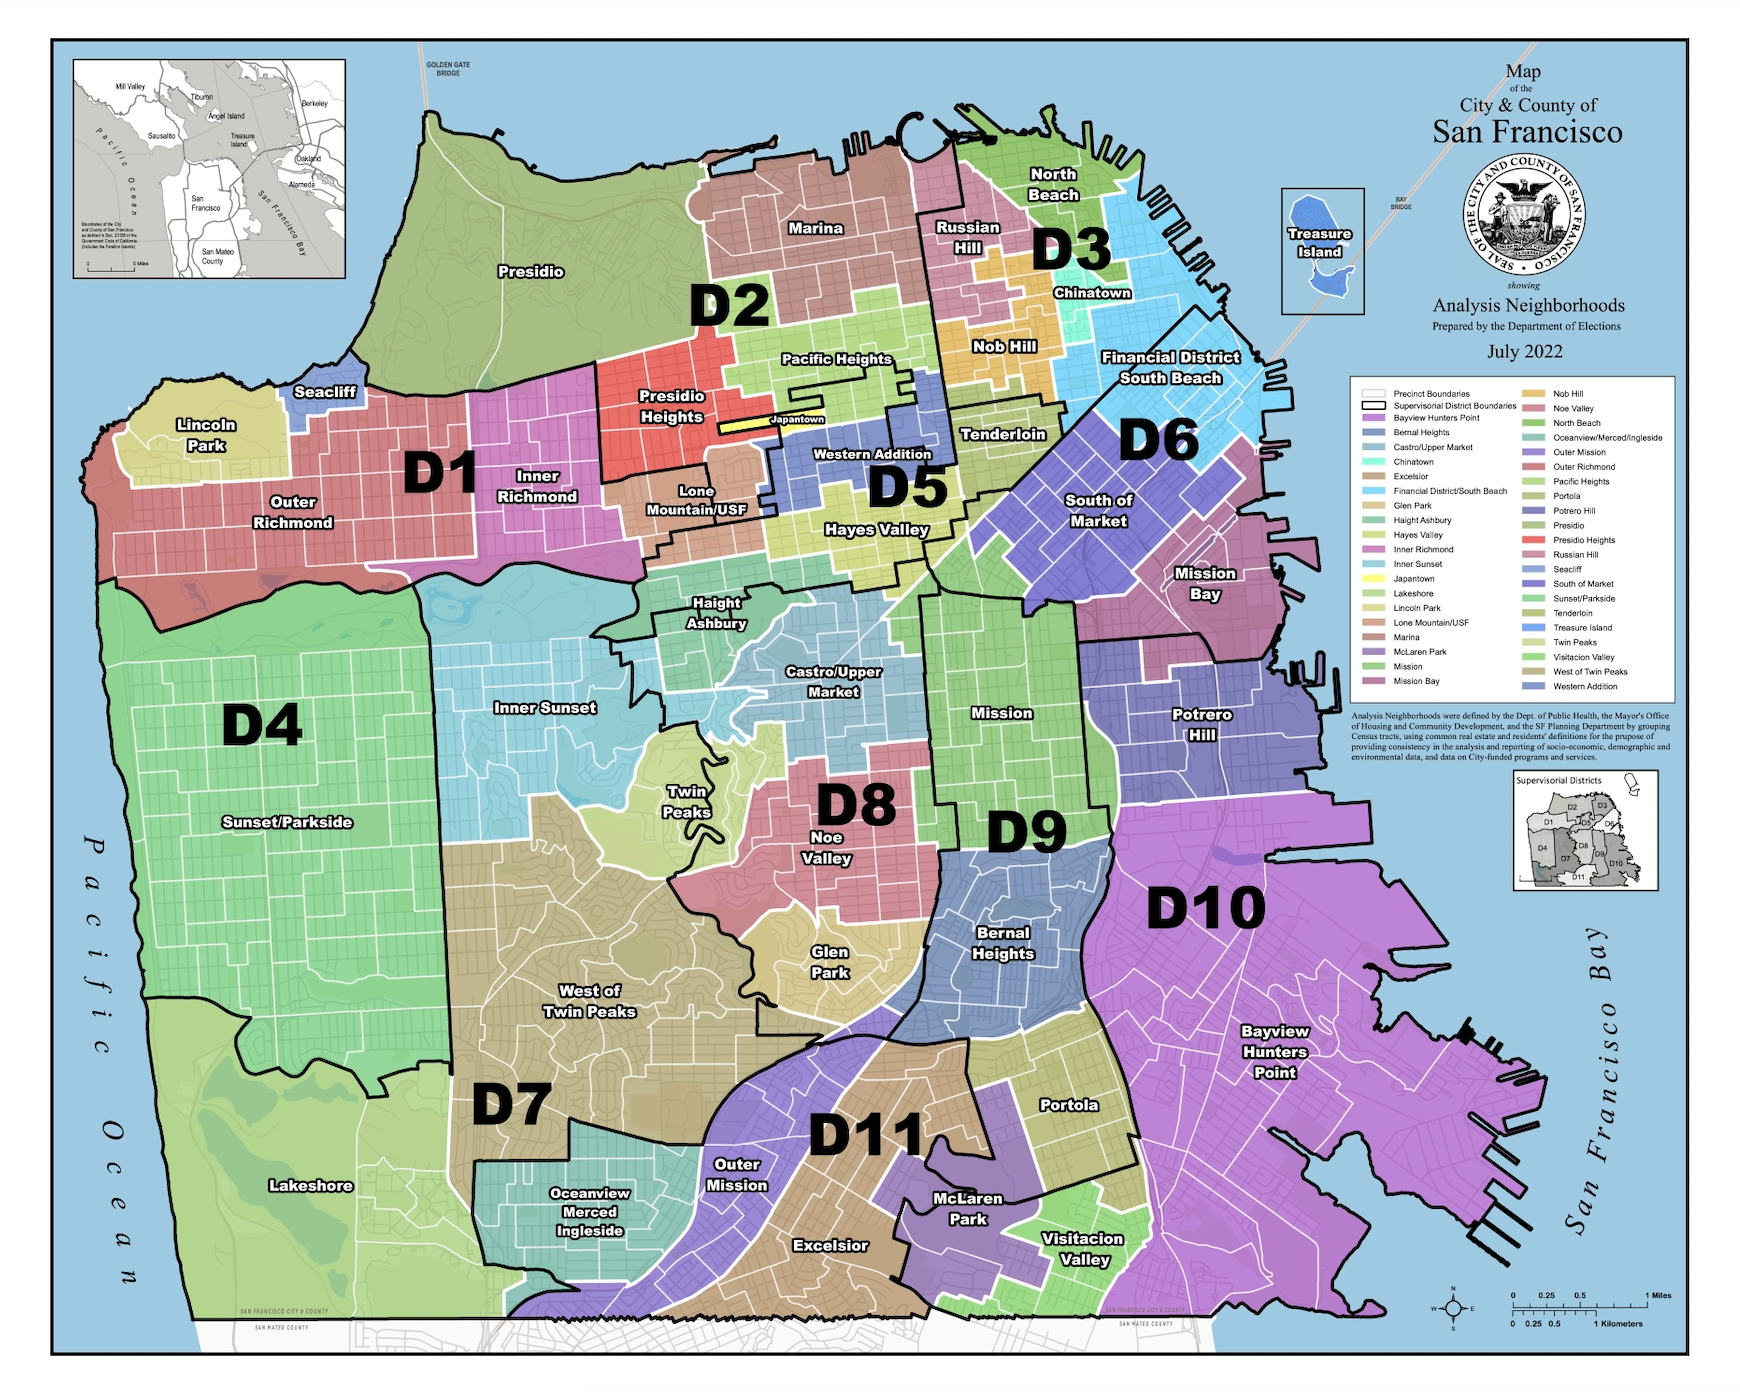
- Parks in Districts 5 and 7 received the highest average score (93) and District 10 received the lowest (87).
- District 9 has the most parks, with 23 compared to District 6’s five.
- District 10 is home to the two parks with the largest declines in scores compared to previous years: McKinley Square (-19.7) and Hilltop Park (-16.5).
- Of the six parks with a perfect score, two are in District 3 (Fay Park, Washington Square), two are in District 7 (Sunnyside Conservatory, West Portal Playground), and there is one each in District 10 (Gilman Playground) and District 1 (DuPoint Tennis Courts).
It’s also important to note that, across the board, progress is being made. Since the first report was released in 2015, the average park score has increased from 86.3 to 91. Gilman Playground went from being the second worst ranked park in 2015 (scoring 61) to being one of only six parks that scored 100 this year. Taking care of our parks is a never ending process, but crucial data from reports like the San Francisco Park Maintenance Scores help us ensure everyone in San Francisco has access to a well-loved park.
A challenge for you: Get out and explore. Start by seeing if any of our Community Partners are in your neighborhood - most host volunteering days and provide a great way to improve your neighborhood! If you’re looking for a solo adventure, try checking out a park outside your neighborhood. It may be a trek, but while you’re at it you can use the Slow Streets Network to get there.